We've just published 6.1.3 and it includes Prometheus Alertmanager support, new counters in the Prometheus endpoint for memory info, automatic query timeout, Monaco as the new SQL editor for QuestDB's web interface, and more UI additions. Here's a roundup of changes that have just landed in the latest and greatest version!
Monaco Editor from VS Code in QuestDB UI
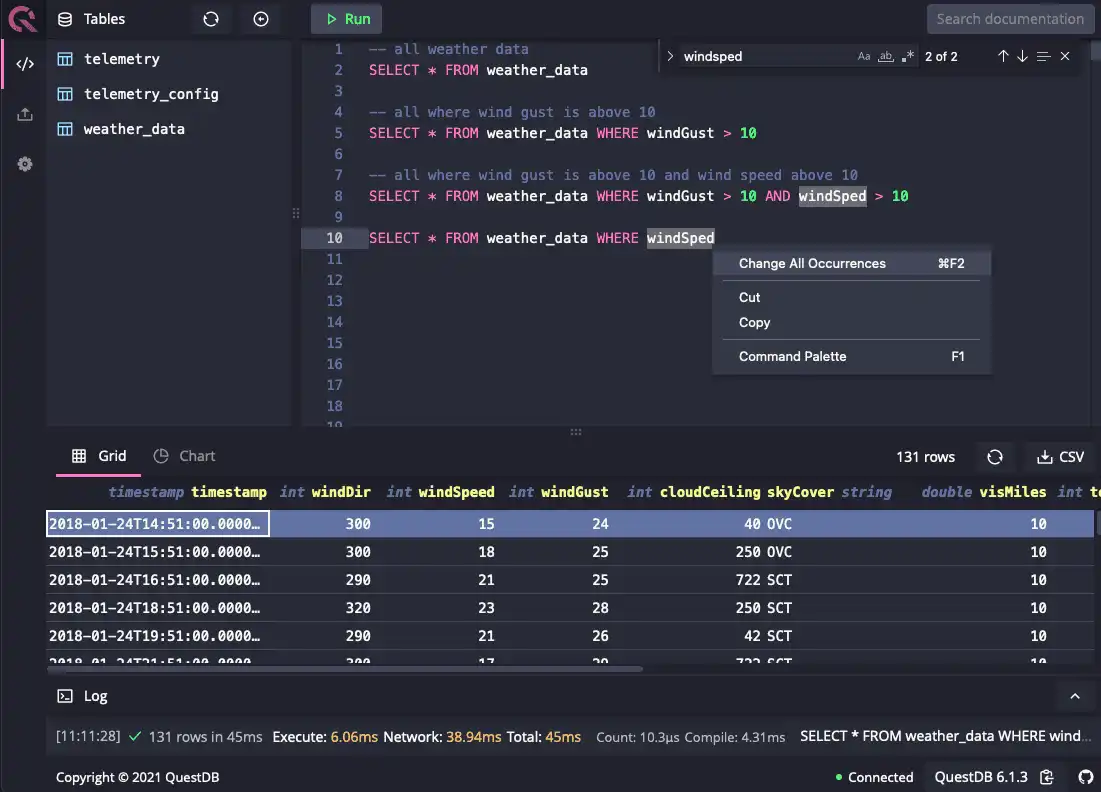
The SQL editor in QuestDB's web console now includes the Monaco Editor that powers VS Code. Upgrading the SQL editor to use the Monaco Editor brings with it many improvements and functionality that comes by default with VS Code, so now you get convenient features like bracket matching, find and replace-all, multiple cursor selection, and more right out of the box:

For more information on using the Monaco Editor in QuestDB, type F1 in QuestDB's web console, or refer to the official Monaco documentation.
Prometheus metrics
Prometheus is an open-source systems monitoring and alerting toolkit which collects and stores metrics as time series data. Prometheus collects small pieces of data about many components to help build a picture of the state and trajectory of a system. The scraped metrics are stored, and rules can be applied to aggregate and generate new metrics from existing data or generate alerts based on user-defined triggers.
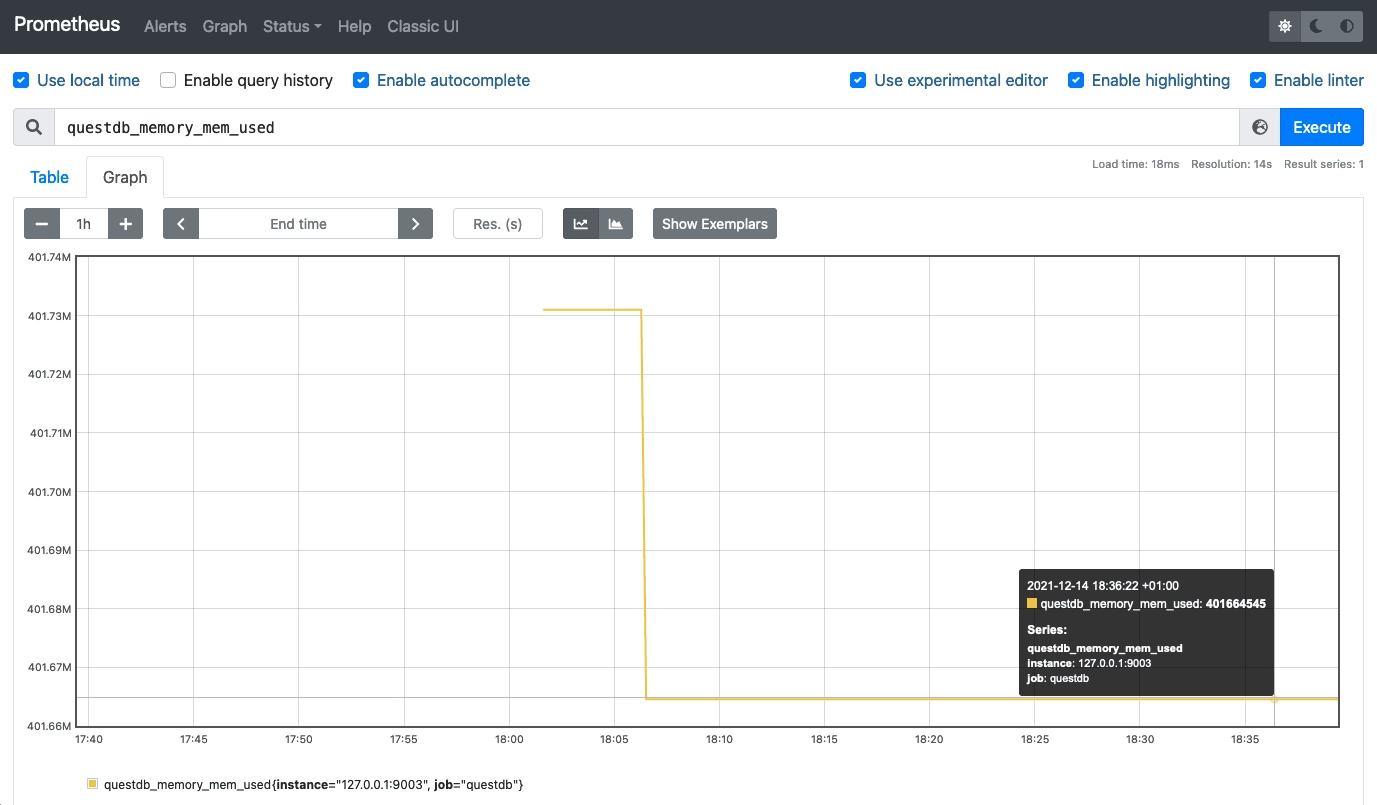
QuestDB has a /metrics HTTP endpoint on port 9003 which provide counters in
Prometheus format. Prometheus can be used to visualize and graph QuestDB metrics
prefixed with questdb_:

For more information on configuring QuestDB and Prometheus to graph QuestDB metrics, see the Prometheus documentation for examples and hints for setup and configuration.
Prometheus Alertmanager
Release 6.1.3 introduces a new log writer for QuestDB that sends any message to
Prometheus
Alertmanager. To
configure this writer, add it to the writers config alongside other log
writers. Details on logging configuration can be found in
Logging & Metrics.
Configuring that QuestDB should send alerts to Alertmanager alerting is done in QuestDB's log config with the address and port for Alertmanager:
# Which writers to enable
writers=stdout,alert

# Prometheus Alertmanager
w.alert.class=io.questdb.log.LogAlertSocketWriter
w.alert.level=CRITICAL
w.alert.alertTargets=172.17.0.2:9093
For details on configuring QuestDB to send alerts to Alertmanager, see the Prometheus documentation for examples and guides for setup and configuration.
SQL syntax for bulk inserts
It's now possible to bulk insert vales into a table via SQL. This functionality
follows the 'multirow' VALUES syntax used in PostgreSQL and acts as an
accelerator when inserting data in bulk:
CREATE TABLE my_table(id SYMBOL index, val DOUBLE,ts TIMESTAMP)
  timestamp(ts);

INSERT INTO my_table
VALUES
    ('d1', 101.1, '2021-10-05T11:31:35.878Z'),
    ('d1', 101.2, '2021-10-05T12:31:35.878Z'),
    ('d2', 201.2, '2021-10-05T12:31:35.878Z'),
    ('d2', 201.3, '2021-10-05T13:31:35.878Z'),
    ('d2', 201.4, '2021-10-05T14:31:35.878Z');
Automatic SQL query timeout
Users can now define automatic timeouts for SQL queries via server
configuration. This is set using the query.timeout.sec server configuration
and is a global timeout in seconds used for long-running queries. For more
information on setting this parameter, see the
server configuration documentation.
# Default is 60 sec
query.timeout.sec=60
Timeout for each query can override the default by setting HTTP header
Statement-Timeout or Postgres
options.
Next up
The team will be adding Java 17 support in the next release, meanwhile, we're
working on UPDATE/DELETE support, a JIT (Just-in-time) compiler for filters,
and more stability improvements on InfluxDB line protocol.
We hope you enjoyed the features and functionality in version 6.1.3. See the release notes on GitHub for the complete list of additions and fixes. We’re eagerly awaiting your feedback, so feel free to reach out and let us know how it's running. You can let us know how we're doing or just come by and say hello in our community forums or browse the repository on GitHub.